Services
My name is
Driving Data-Driven Decisions: Expertise in Tableau and Analytical Insight for Strategic Growth With three years of experience, I specialize in business intelligence analysis, data visualization, and podcast hosting. My goal is to enhance your organization’s data strategy by providing actionable insights and empowering informed decision-making.
Download Resume
Who Am I?
As a Data Analyst with passion for deriving actionable insights from complex data. I have 3 years of experience conducting in-depth descriptive and prescriptive analyses to help organizations optimize processes and aid data-driven decision making. Skilled in SQL, Excel and data visualization tools like Tableau and Power BI. I excel at communicating complex findings and relationships in an easy-to-understand manner to both technical and non-technical stakeholders.I am eager to bring my analytical mindset,technical skills, and strong communication abilities to help your organization unlock deeper insights from data that drive growth and innovation. If you have a data analytics role that matches my qualifications, please reach out to discuss how I can contribute value.
Download ResumeWhat I'm Doing Now
Currently, I'm a Freelance Business Intelligence analyst, I build and maintain business dashboards for clients.I am also a host at Real time with t&m podcast where I talk about the ups and downs of the Data field, give you a behind-the-scenes look at the industry, and share practical advice to help you navigate your own data career path. I am actively searching for the best organization and team that can leverage my skills to their maximum potential and produce powerful and informative work that drives strategic decision-making.
Download ResumeServices
Detecting and correcting errors, inconsistencies, duplicates, and missing values in data, with combining data from different sources, and ensuring consistency.
Converting raw data into a usable, analysis-ready format. such as data type conversions, normalization, aggregation, and developing data models, for example, conceptual, logical, and physical data models to structure data for analysis.
Creating interactive visual representations such as charts, graphs, and dashboards to communicate insights and findings in tables, graphs, dashboards, and slide decks to share with stakeholders.
My works
Career path
Washington DC, United States (Remote)
Feb 2024 - Present
London, United Kingdom (Remote)
Jan 2024 - Present · Contract
Las Vegas, Nevada (Remote)
Dec 2022 - Oct 2023 · Full-time
Odense, Southern Denmark (Remote)
Jan 2022 - Jul 2022 · Full-time
Portharcourt, Rivers State
Nov 2020 - Jan 2022 · Full-time
Portharcourt, Rivers State
Oct 2018 - Aug 2020 · Full-time
Learning Path
Bachelor's degree - Applied Biochemistry
2019
Data Analyst Tutor - Data Analytical Tools (SQL, Excel)
2022
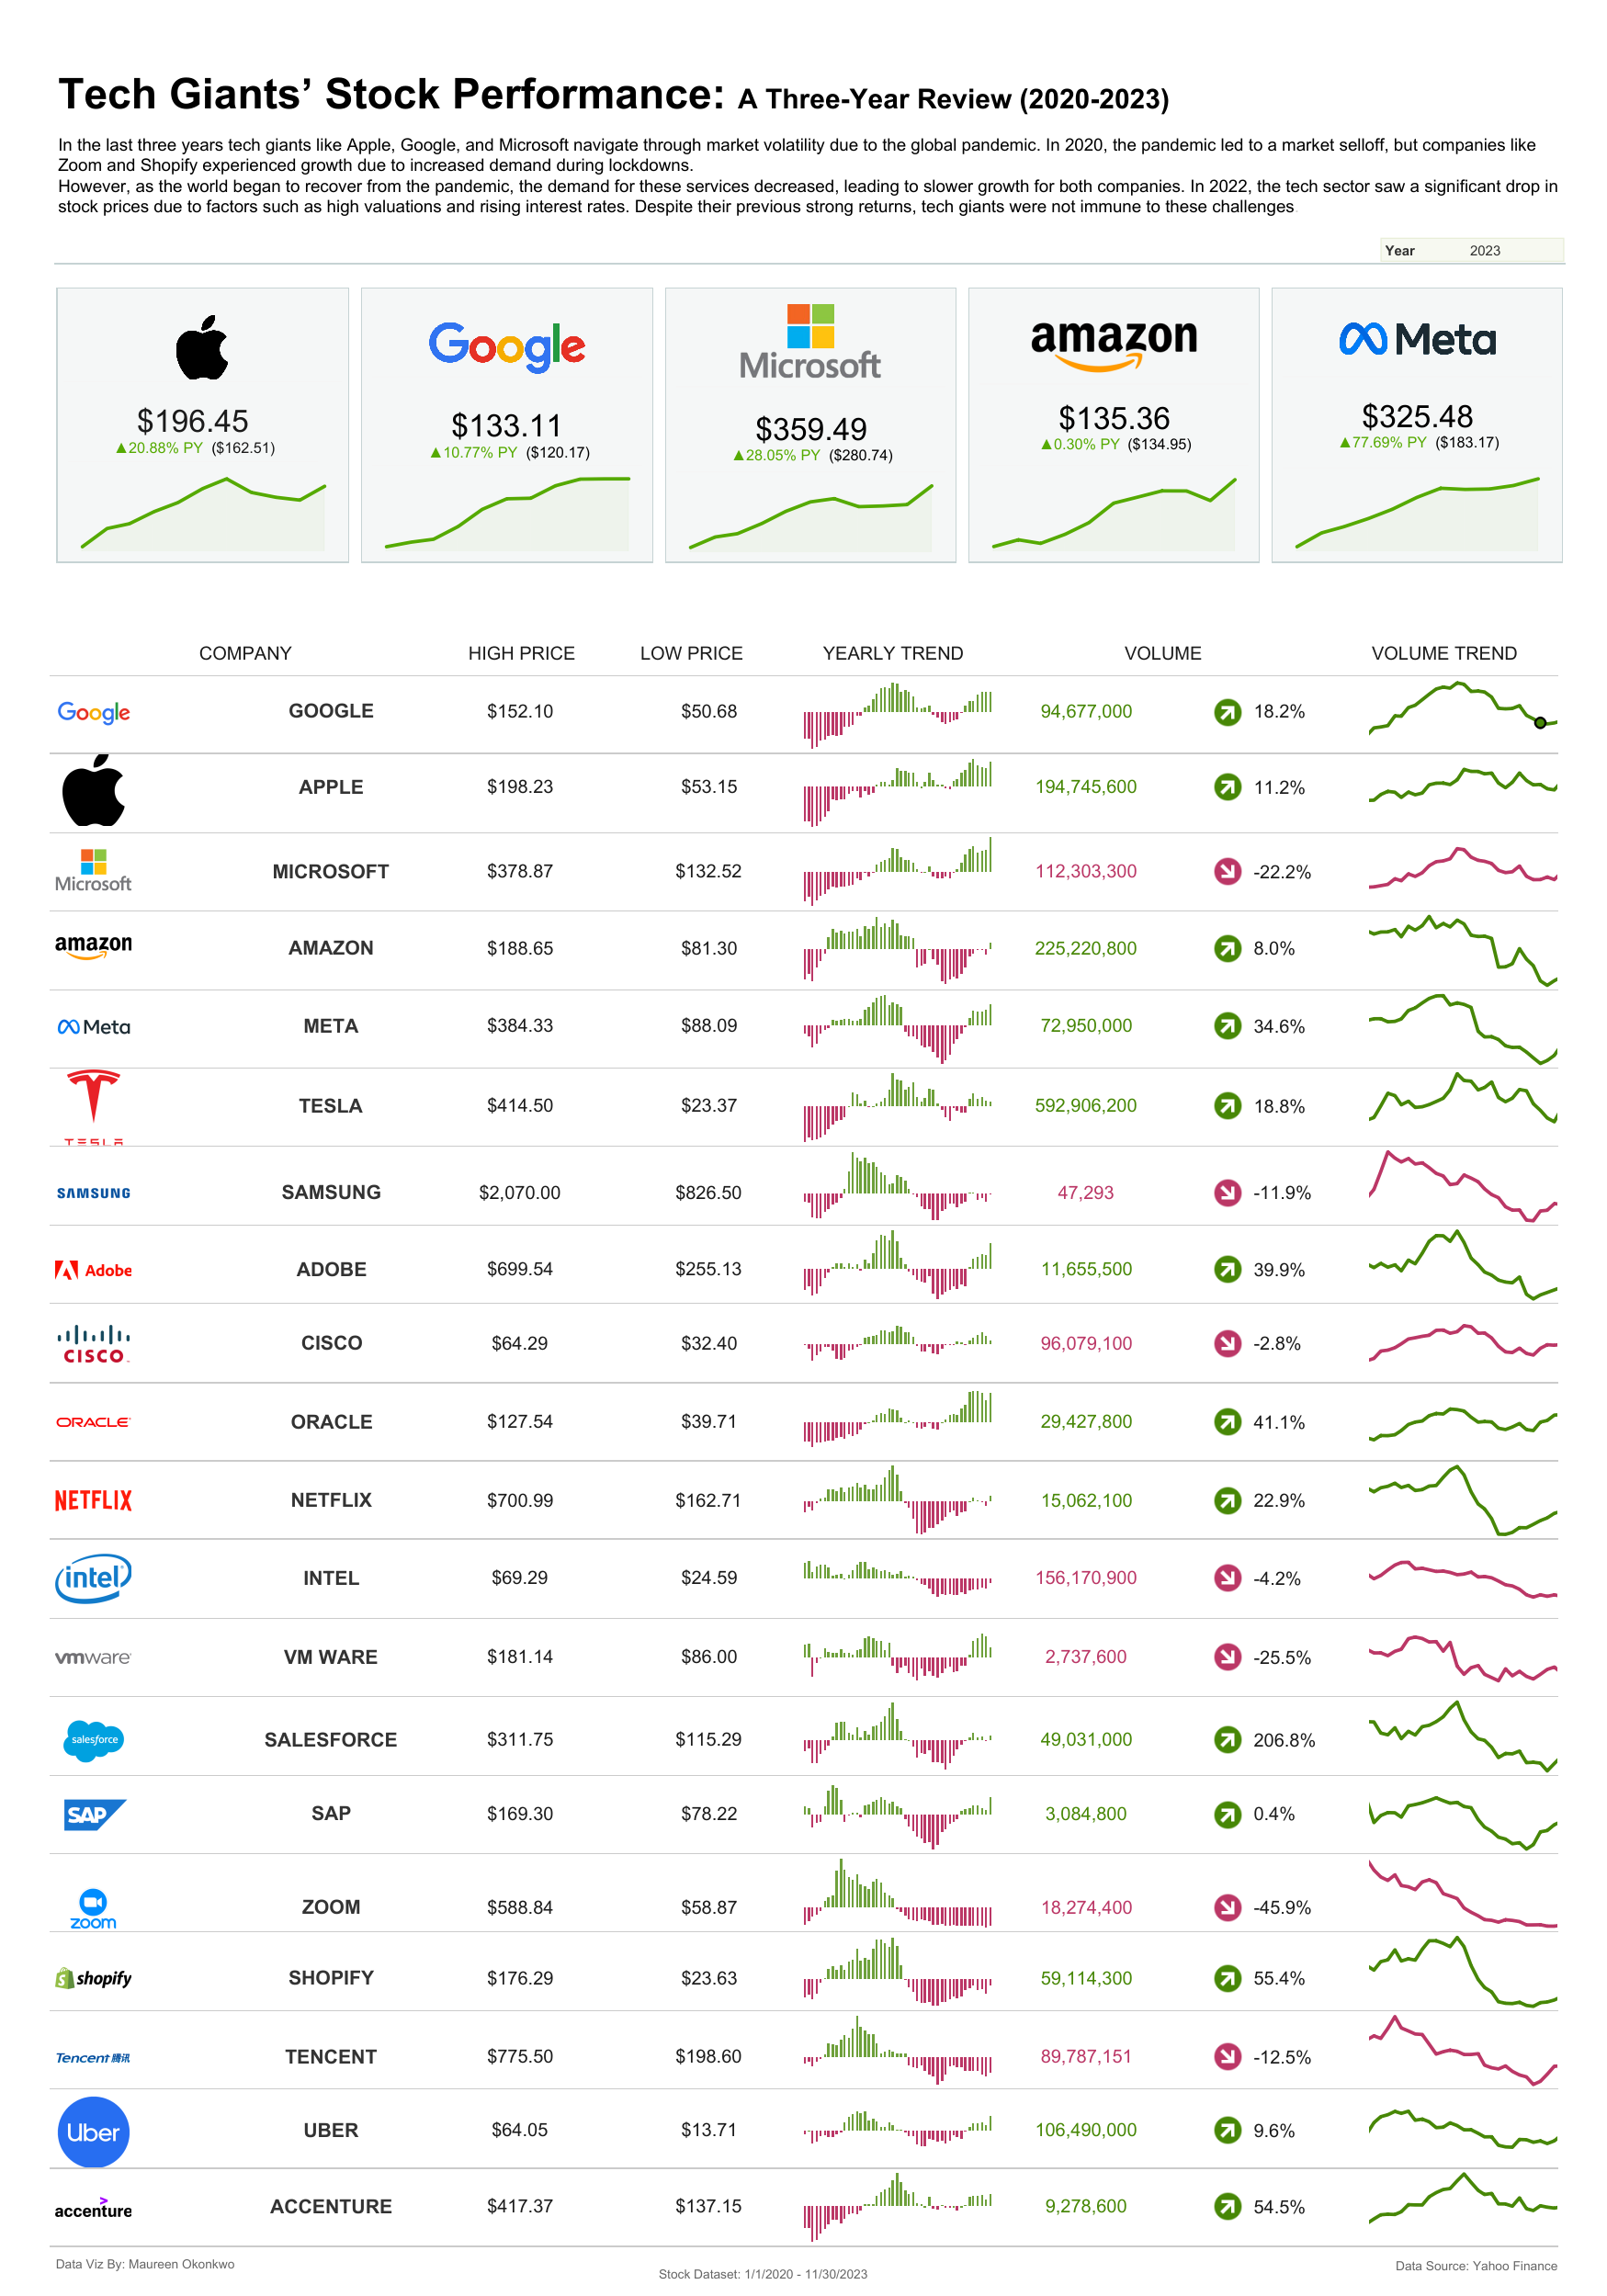
While I search for the proper company fit, I am working on a personal ongoing project where I tell stories with data and build pseudo business dashboards across various industries. I release data storytelling projects every week and business dashboards every month on my Tableau public and LinkedIn.
maureenokonkwo03@gmail.com